Computer science concepts
Shop Visibility And Commerce Analytics
Tests the ability to run cohort analysis and time-series aggregation to quantify shop visibility, apply dedup/ranking logic, and design stable…
What's being tested
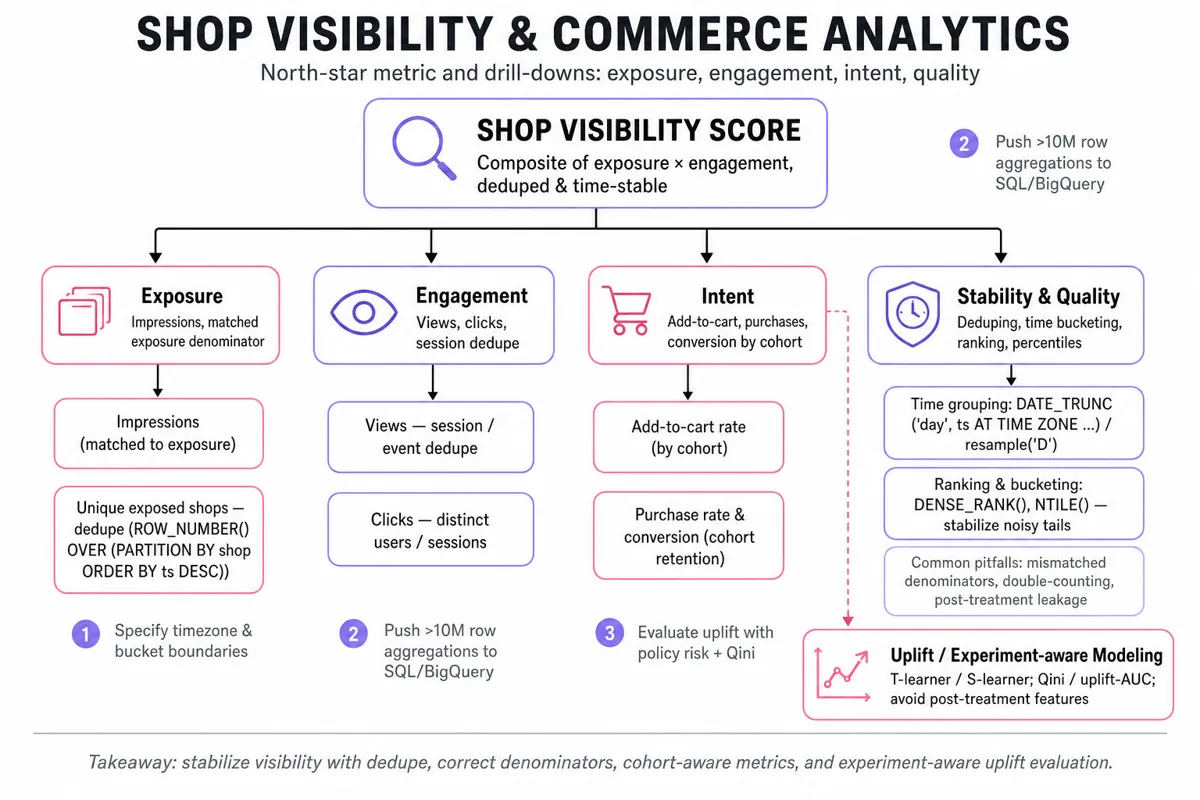
Tests the ability to run cohort analysis and time-series aggregation to quantify shop visibility, apply dedup/ranking logic, and design stable visibility/intent metrics. Also probes experiment-aware modeling and uplift modeling for causal buyer-engagement decisions.
Patterns & templates
-
Window functions for deduping and last-event logic —
`ROW_NUMBER()`OVER (PARTITION BY shop ORDER BY ts DESC); tie-break with deterministic id. -
Time-based grouping using
`DATE_TRUNC('day', ts AT TIME ZONE ...)`or`ts::date`; always specify timezone and bucket boundaries. -
Conditional aggregation idiom:
`SUM(CASE WHEN event='view' THEN 1 ELSE 0 END)`or`COUNT(DISTINCT CASE WHEN ... END)`; use`FILTER`when available. -
Cohort assignment: compute
`first_seen_date`per shop, then join a calendar of relative days to measure retention/decay across cohorts. -
Ranking & percentiles:
`DENSE_RANK()`or`NTILE()`over visibility metric; report distribution buckets to stabilize noisy tails. -
Uplift modeling templates: T-learner / S-learner or meta-learners; evaluate with Qini/ uplift-AUC and policy risk, avoid post-treatment features.
-
pandasperformant idioms:`df.groupby(['shop','date']).agg(...)`,`resample('D')`; push heavy aggregations back to`SQL`/`BigQuery`for >10M rows.
Common pitfalls
Pitfall: Using impressions as denominator then comparing to views without matching exposure leads to biased visibility ratios.
Pitfall: Double-counting events across overlapping time-windows or failing to dedupe session-level events inflates metrics.
Pitfall: Training an uplift model using post-treatment features or leaking future exposure produces overly optimistic policy estimates.